User Guide
This guide highlights important notes, default behaviors, and specific options you should be aware of when using SummaryTables.
Which Table Should I Use?
A quick reference guide for choosing the right table based on your data and goals:
- Table 1 / Main Summary: Use the Summary Table without adding a Grouping Variable for a general overview.
- Categorical Outcome: Use the Summary Table with your outcome added to the Grouping Variable.
- Continuous Outcome: Use the Continuous Table.
- Only Two Categorical Variables: Use the Cross Table for a straightforward cross-tabulation.
- Likert Scale Data: Use the Likert Table.
- Survival Analysis: Use the Survival Table for Kaplan-Meier estimates and survival statistics.
- Regression Models: Use Univariable Regression (fits a separate model for each variable) or Multivariable Regression (fits a single combined model).
General Behaviors & Features
Manual Run Mode
By default, jamovi automatically runs an analysis every time you change a setting. Because SummaryTables does not cache or save any previous outputs, it must build the entire table from scratch on every single run.
This creates a severe cumulative calculation overhead. Any individual action triggers a full run. For example, when using Univariable Regression:
- If you drag and drop 10 variables one by one, jamovi triggers 10 separate runs. The 1st run fits 1 model to build the first table. When you add the second variable, it doesn't just add a model to the existing table; the old table is discarded, and it builds a new table from scratch by fitting the first model again and the new second model. The 3rd run fits 3 models from zero, and so on. By the time you add the 10th variable, the module has needlessly fitted a total of 55 models (1+2+3+...+10).
- The same applies to options: changing 5 different checkboxes one after another triggers 5 complete recalculations of the entire table.
To prevent this snowballing delay, you can enable Manual Run Mode.
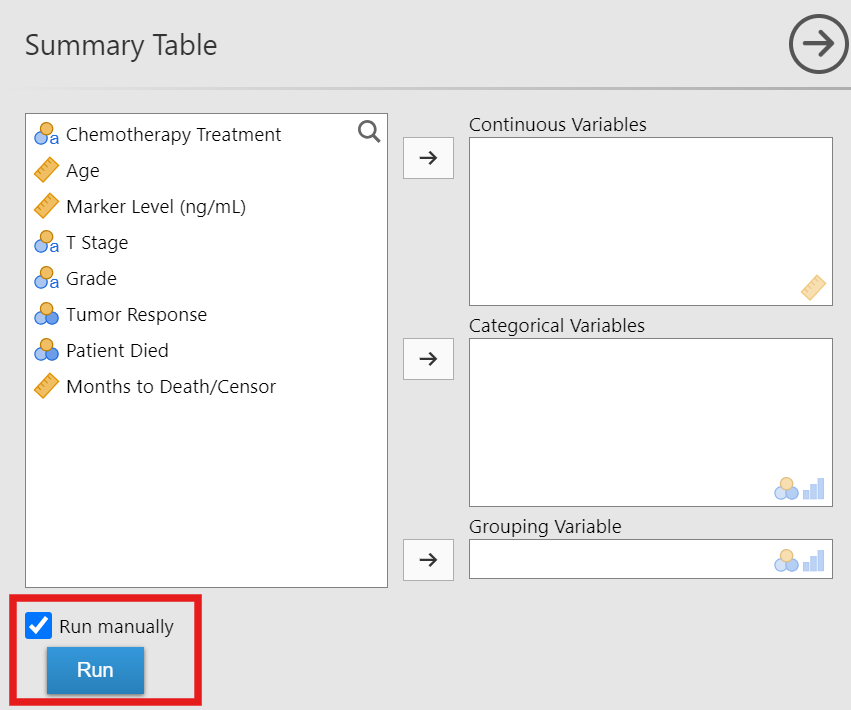
Checking the Run manually option disables the auto-run behavior and activates the Run button. This allows you to add all 10 variables at once and set all your options without triggering any calculations. Once everything is set up, click Run to calculate the final table exactly once—fitting just the 10 models you actually need. This saves a huge amount of time, especially for computationally heavy tables like regressions.
Save to Word
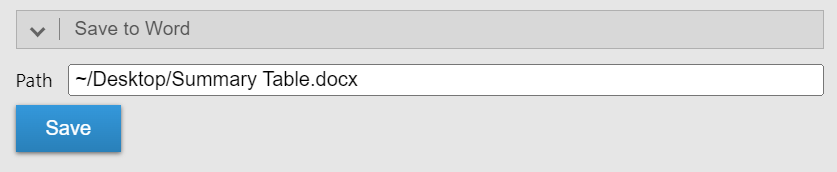
SummaryTables allows you to save any table directly as a .docx file for easy inclusion in manuscripts. To use this feature, simply type the complete folder location where you want to save the file, followed immediately by your desired file name ending in .docx into the Path text box, and then click the Save button. The module produces native Word tables and accurately preserves the styling and formatting of the table.
Overwriting Files
When saving a table, if you type a filename that already exists in your chosen folder, the module will silently overwrite the entire existing Word file without a warning prompt. Please double-check your folder path and filename before clicking Save to avoid accidentally deleting an older document.
Cloud Limitation
Please note that the "Save to Word" feature is not available on the cloud version of jamovi due to security limitations.
Rounding
SummaryTables provides two distinct sets of rounding options: one for general statistics, and one specifically tailored for p-values.
General Statistics
You can independently set the rounding rules for various elements in your tables (such as summary statistics, coefficients, and confidence intervals) using the Decimal places dropdowns.
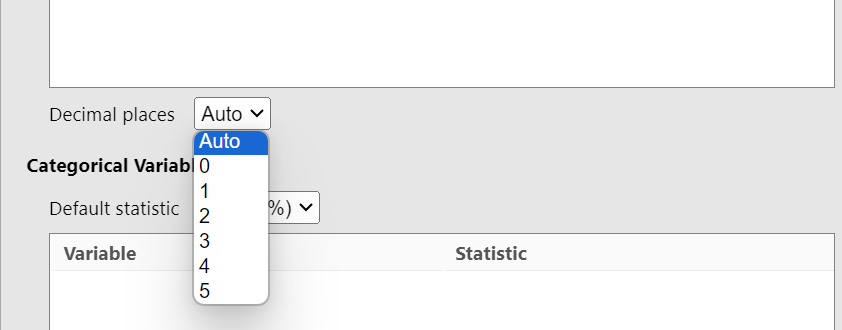
- Auto (Default): Typically uses adaptive decimal places, though certain themes may affect this behavior.
- Fixed (0-5, 16): Uses a fixed number of decimal places.
P-Values
The p-value Decimal places dropdown controls the rounding of large p-values, while precision automatically increases as p-values get smaller.
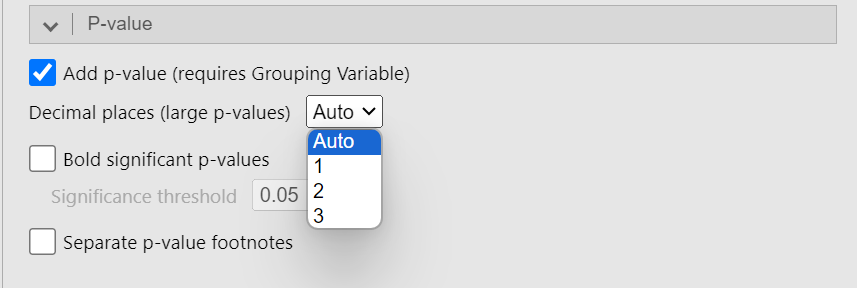
- Auto (Default): Depends on the theme (the default theme uses "1").
- 1: Large p-values are rounded to 1 decimal place. Precision automatically increases to 2, then 3 decimal places as values get smaller. Extremes are shown as
>0.9and<0.001. - 2: Large p-values are rounded to 2 decimal places. Precision automatically increases to 3 decimal places as values get smaller. Extremes are shown as
>0.99and<0.001. - 3: All p-values are rounded to 3 decimal places. Extremes are shown as
>0.999and<0.001.
Statistical Tests
The module automatically selects appropriate statistical tests based on your data types and the number of groups across the Summary Table, Continuous Table, and Cross Table. You can configure this behavior using the Default test dropdowns:
Continuous Variables
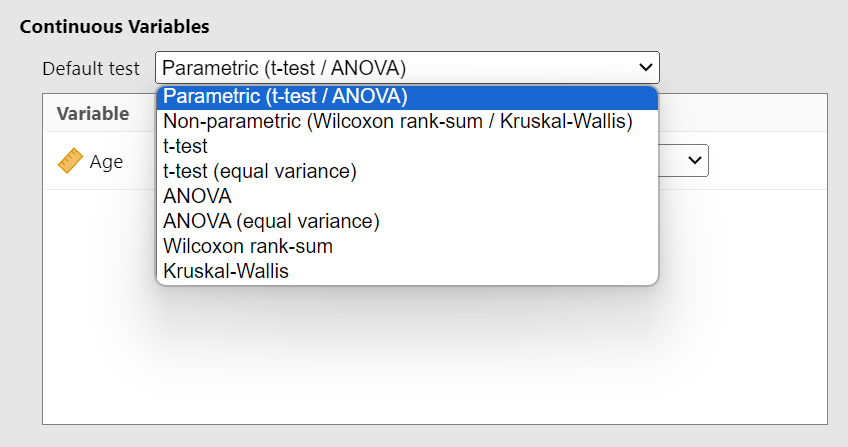
- Parametric (Default): Uses the independent t-test (not assuming equal variance) for 2 groups, or one-way ANOVA (not assuming equal variance) for >2 groups.
- Non-parametric: Uses the Wilcoxon rank-sum test for 2 groups, or Kruskal-Wallis rank-sum test for >2 groups.
Grouping Variable in the Continuous Table
If you add a Grouping Variable in the Continuous Table, the module automatically calculates p-values using a two-way ANOVA. In this specific configuration, no other statistical tests can be applied.
Categorical Variables
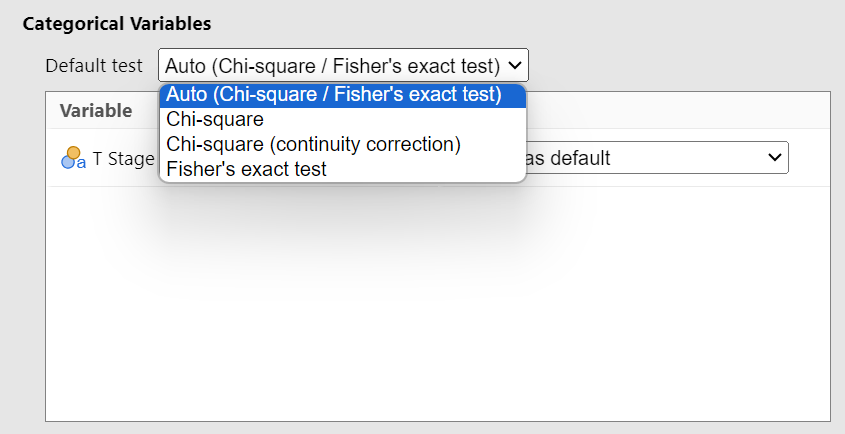
- Auto (Default): Uses Pearson's Chi-square test (without continuity correction) if all expected cell counts are ≥ 5. It automatically falls back to Fisher's exact test if any expected cell count is < 5.
Variable-Specific Tests
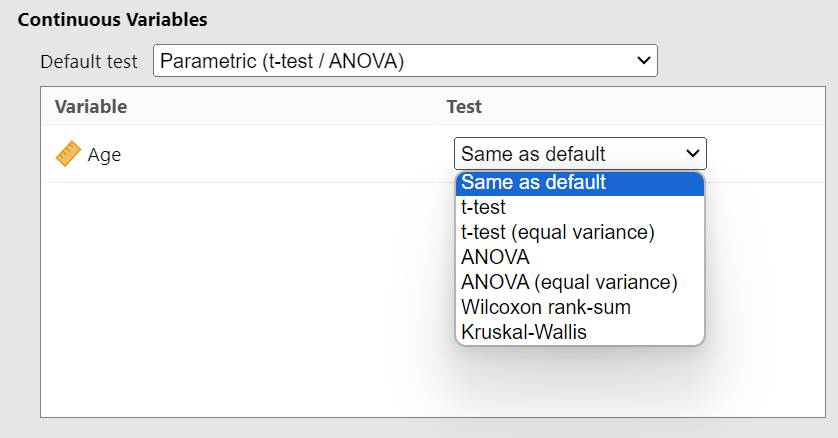
If you want specific tests for specific variables, you can manually select a different test for individual variables. For example, if your default is set to Parametric (t-test / ANOVA), you can manually set a specific variable to use the Wilcoxon rank-sum test.
Table-Specific Notes
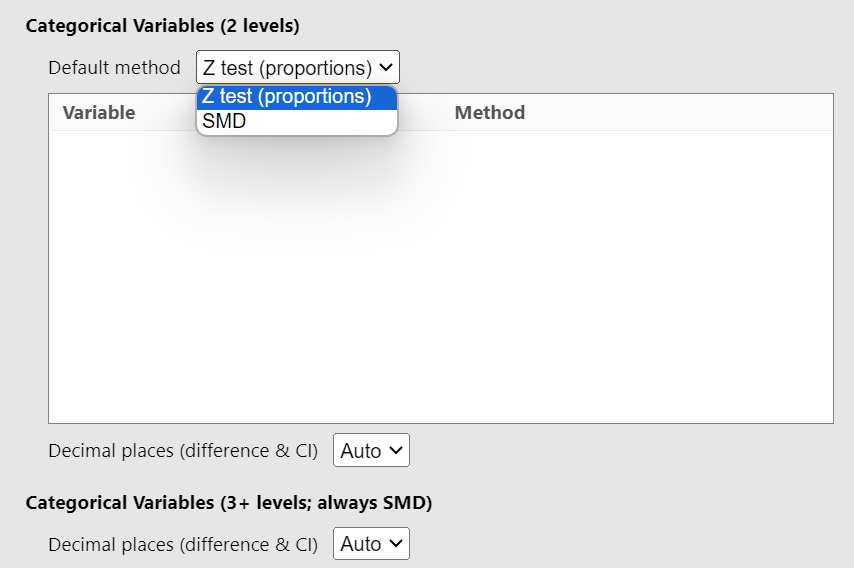
Summary Table: Difference
SMD Method Calculation
When you select SMD as your Difference method, the values are calculated using the smd R package.
Multiple P-Value Columns Error
If you select a Difference method that generates a p-value and you also check the P-value option under the general P-value section, an error will occur. The table cannot display multiple p-value columns simultaneously.

Regression Tables: Univariable vs. Multivariable
It is important to understand the fundamental difference in how Univariable Regression and Multivariable Regression tables are constructed:
- Univariable Regression: Fits one separate model per predictor. If you add 5 variables to Covariates and Factors, the module will fit 5 distinct simple regression models (each predicting the dependent variable using just that one predictor) and combine the results into a single table.
- Multivariable Regression: Fits one single model containing all predictors. If you add 5 variables to Covariates and Factors, the module will fit a single model where all 5 variables are included simultaneously, adjusting for each other.
Regression Tables: Standardized Coefficients
For linear regression models, SummaryTables allows you to report standardized coefficients.
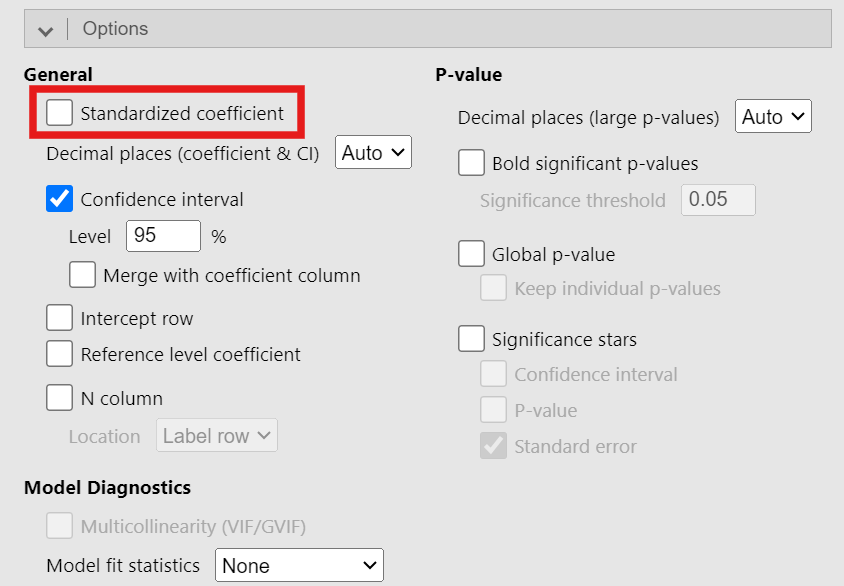
Difference from SPSS
If you are coming from SPSS, your results might look different because SPSS standardizes all variables, whereas we do not standardize Factors. We only standardize continuous variables (including Covariates and the Dependent Variable). This approach—which is also used by jamovi's default linear regression and GAMLj—is comparable to the "refit" method in the parameters R package.
Survival and Cox Regression: Event Variable Coding
When using the Survival Table or Cox Regression analyses, the Event variable must be coded correctly:
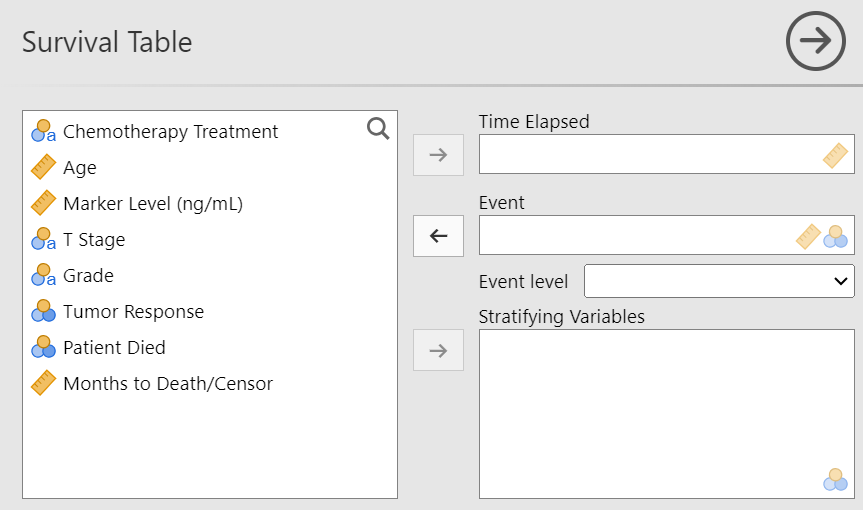
- If continuous: You can use either
0and1(0 = censored, 1 = event) OR1and2(1 = censored, 2 = event). Any other numeric values will cause an error. - If categorical: You must select the specific level that represents the event from the Event level dropdown.